
What is the value of a quantitative analyst? That is a question I have had for some time. Right off the bat, I was able to find an article by Ben Lindbergh and Rob Arthur on FiveThirtyEight dating back to 2016, where they investigated the upward trend in increasing front office sizes in Major League Baseball pulling data from 2016, 2012, and 2009. Their takeaway? “Statheads,” or “quants” as they are often referred to in the industry, are MLB’s biggest free agent bargains.
In Arthur and Lindbergh’s analysis, they pulled each team’s media guide and created a dataset containing the number of full time employees that work in baseball analytics. My design was similar, including only those included in the organization’s media guide with some variation of “Research & Development,” “Baseball Operations Analyst,” “Baseball Analytics” or “Baseball Systems” in their title, while excluding Assistant General Managers and front office executives (sorry, Sig Mejdal and company).
With that, it is important to note that these numbers of the size of each team’s front office are estimates. In fact, there may be considerable variation as we could make the case that each member of a Baseball Operation has a hand in some form of analytics related to on-field performance. That disclaimer is absolutely necessary as this analysis does not account for scouting analysts (international, amateur, advance, etc.), unless they had one of the aforementioned job titles in the organization’s 2019 Media Guide and others that engage in data analysis on a day-to-day basis. Before I ramble any further, let’s just take a look at FiveThirtyEight’s trend graph of MLB analytics teams from 2016.
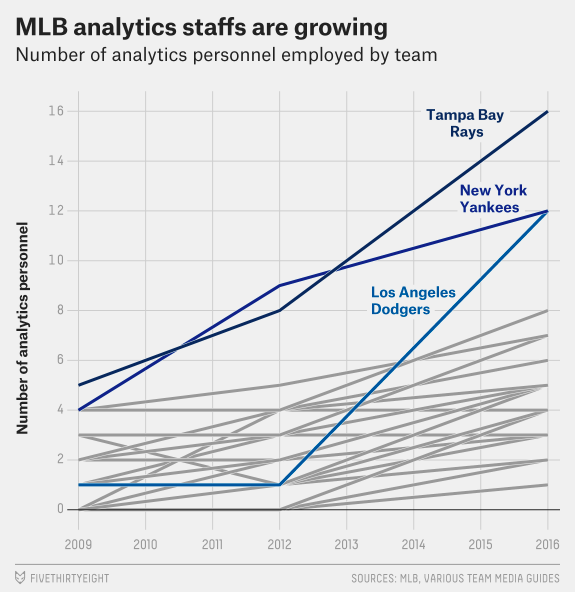
Source: FiveThirtyEight
So, we see that at the time of their writing, analytics teams across the board seemed to be trending upward, which is to be expected. In fact, they had the hypothesis that the trend of baseball analysts working in a front office closely resembled Moore’s Law, or the observation that something doubles every 2 years. Above, the graph highlights three teams: the payroll juggernaut New York Yankees and Los Angeles Dodgers and the low-budget Tampa Bay Rays. In this graph, LA takes a massive jump from 2012 to 2016 employing 12 analysts, and Tampa Bay has 16 analysts, with New York and Los Angeles having 12. Remember those numbers.

Since 2016, each of the three aforementioned clubs — Tampa Bay, New York, Los Angeles — have added an analyst each season on average, increasing their numbers to 20, 18, and 18, respectively. On the low-payroll end, the Rays are pulling the curve up significantly, with the middle budget teams also tending to employ a similar amount of analysts. But if you ignore the Pirates and Rays, you notice many of these low-budget clubs also employ a low number of analysts. I believe that is just as important as the increasing trend of high payroll teams on the far left beginning to recognize the value of a strong R&D department. But how does this relate to winning?
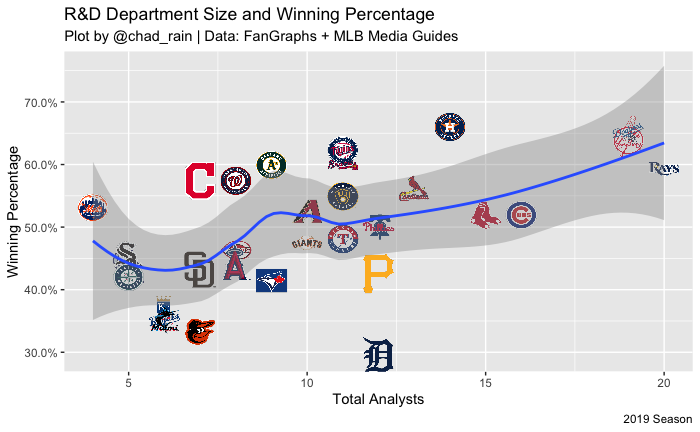
Before I get into the value of analysts, I must say that the greatest contributor to winning percentage is on-field talent. With data-driven player development implemented around the field, the front offices themselves will surely tell you that. Still, the high-quant front offices display a pretty strong correlation coefficient here of 0.54. But we know there are a myriad of factors that go into producing a sustainable, winning output. At the same time, it is impossible to notice the positive trend here.
I wanted to dig deeper, so I took it a step forward to see if the number of front office analysts played any role in success on the field.
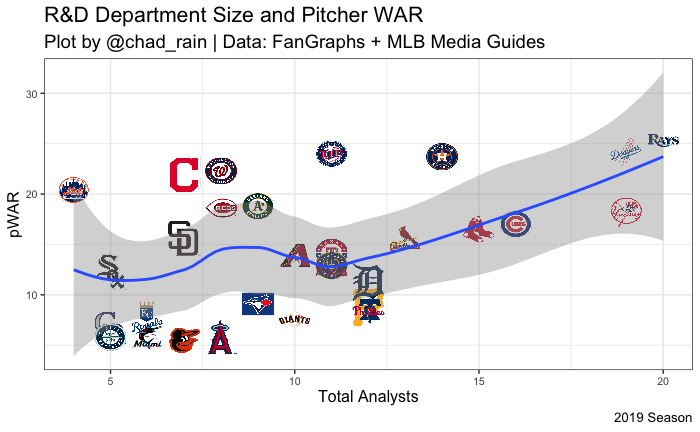
Again, this visualization does not exactly prove that teams that hire more quants develop better pitching. But we should note that this visualization does mirror the earlier R&D department size and winning percentage. You’re probably saying, “Well, yeah, Chad, why does that matter?” Bear with me.

Another similarly shaped curve that follows R&D department sizes with winning percentage and pitcher WAR. Only this time, we replaced R&D with payroll, and we still get a similar result. Which brings us to our last visualization.

In this final visual, we see another moderate positive relationship with the correlation coefficient being 0.44. In his FanGraphs piece, Craig Edwards — who does a great job covering some ideas depicted in this piece — noted that the relationship between payroll and winning is cyclical, with this particular Collective Bargaining Agreement allowing teams that spend to have an advantage, generally speaking. This is all important with the economics of the baseball industry changing so rapidly causing front office downsizing, among other things. But if we see a shift back to more parity regarding payroll size and winning, could the quants take the lead? For some organizations, they may view this time as a growth opportunity to acquire driven data analysts.
To summarize where we are at before we get further along, we see that the number of analysts a team employs does trend positively with pitching statistics (and hitting, which goes unmentioned in this article) and overall success. It would be comical for me to sit here and write that this is the reason teams are winning. But, according to Edwards, the relationship between team payroll and winning percentage was higher than ever in 2019. So as teams grow increasingly similar by their analytical capacities, clubs with the high payroll to go along with advanced analytical capabilities could be the difference between the haves and have nots in Major League Baseball. Perhaps part of getting ahead of the curve analytically is the quantity of quality data analysts.
FiveThirtyEight agreed with this sentiment in 2016, and I believe it still rings true. Their conservative estimate was that a group of 5 added data analysts at a cost of $350,000 would net 2 additional wins per season. If we know the cost of 1 WAR in free agency is approximately $9.1 million, that makes the R&D analyst market 52 times more efficient than the free agent market.
Sticking to the economics train of thought that we are on here (disclaimer: I come from an economics background), I have to note that at some point, the marginal product of labor is going to diminish. That means that when we reach a threshold of workers, productivity per additional unit of labor decreases, and output (additional wins, in this case) begins to slow down. My guess is that with so many driven quants waiting for that opportunity to make an impact, we reach that point well beyond five additional data analysts. Unfortunately, I can’t pin a number to the precise contribution of each worker like we can in an intro level economics homework question, so I can’t tell you where diminishing returns begin. But I can try to quantify the general contribution of one additional quant.

Part of analyzing data is finding signals among noise, so in this instance, I am looking at the formula (wins as a product of analysts and payroll), our estimates for how much 1 additional unit of analysts and payroll impacts wins, significance level, and the R-squared value. Though it is not statistically significant, meaning it does not fit well in this model, one extra dollar provides teams with 0.00000008910 additional wins, meaning a team would have to spend $11,223,345 to gain an additional win across a 162 game season. I am going to skim past that to get to the fun part.
We see that adding 1 additional analyst drives our projected wins up by nearly 1.584, and it is statistically significant at the p < 0.05 level as indicated by the single asterisk. This is where I have to suspend my bias and understand that just because analysts and wins are potentially related variables, on field talent is the major factor accounting for extra wins. So for fun, I’ll arbitrarily cut that number by one-fourth, and say that 1 analyst provides 0.396 wins per season, which means 5 analysts provide 1.98 wins across an entire season. And that aligns with FiveThirtyEight’s estimate that 5 analysts at a price of roughly $350,000 accounts for a minimum of 2 wins.
So, what is my effective spin here? Hire more quants. Of course, this is easy for me to say as I work towards a potential career in baseball. But I do know the demand for jobs in baseball operations seems to increase every year, so it will be up to individual clubs to decide what their supply of front office baseball analytics positions will be for the next season or two. In my view, having more brain power, or a group of driven analysts working in a collaborative environment with the common goal of winning should net only positive results. Again, easy for me to say.
Growth Opportunities and Further Discourse:
- Compile data from seasons prior to 2019 and see if we get similar results
- Study the impact of spending/winning across multiple seasons
- Can we determine the precise point that we could expect to see diminishing returns?
- How can we further explain exactly how quantitative analysts provide value?
- Using publicly available information/data, how do we determine which clubs have the “best” analytics departments?
If you have any feedback/thoughts regarding this reading, the growth opportunities about this piece, or you simply want to chat, feel free to reach out to me on Twitter, email me raincs20@wfu.edu, or connect with me on LinkedIn.
Very nice blog. I was wondering why you arbitrarily cut the model prediction of adding an analyst by 1/4. Have you dug in to any further years to see if the trend continues? It would be interesting to see if other teams have copied the Rays maybe the Giants in 2021.
“At the same time, it is impossible to notice the positive trend here.”
Need better graphs, I guess.
Also, since analysts deal with numbers, it’s surprising that none of them seems to know the difference between ‘number’ and ‘amount’. You do not have an amount of analysts, you have a number of them. ‘Amount’ is for continuous quantities, whereas ‘number’ is for discrete entities. Thus, an amount of beer but a number of bottles.